diagramsDiagram TypesGit Graph Diagrams
Git Graph Diagrams
Git Graph Diagrams
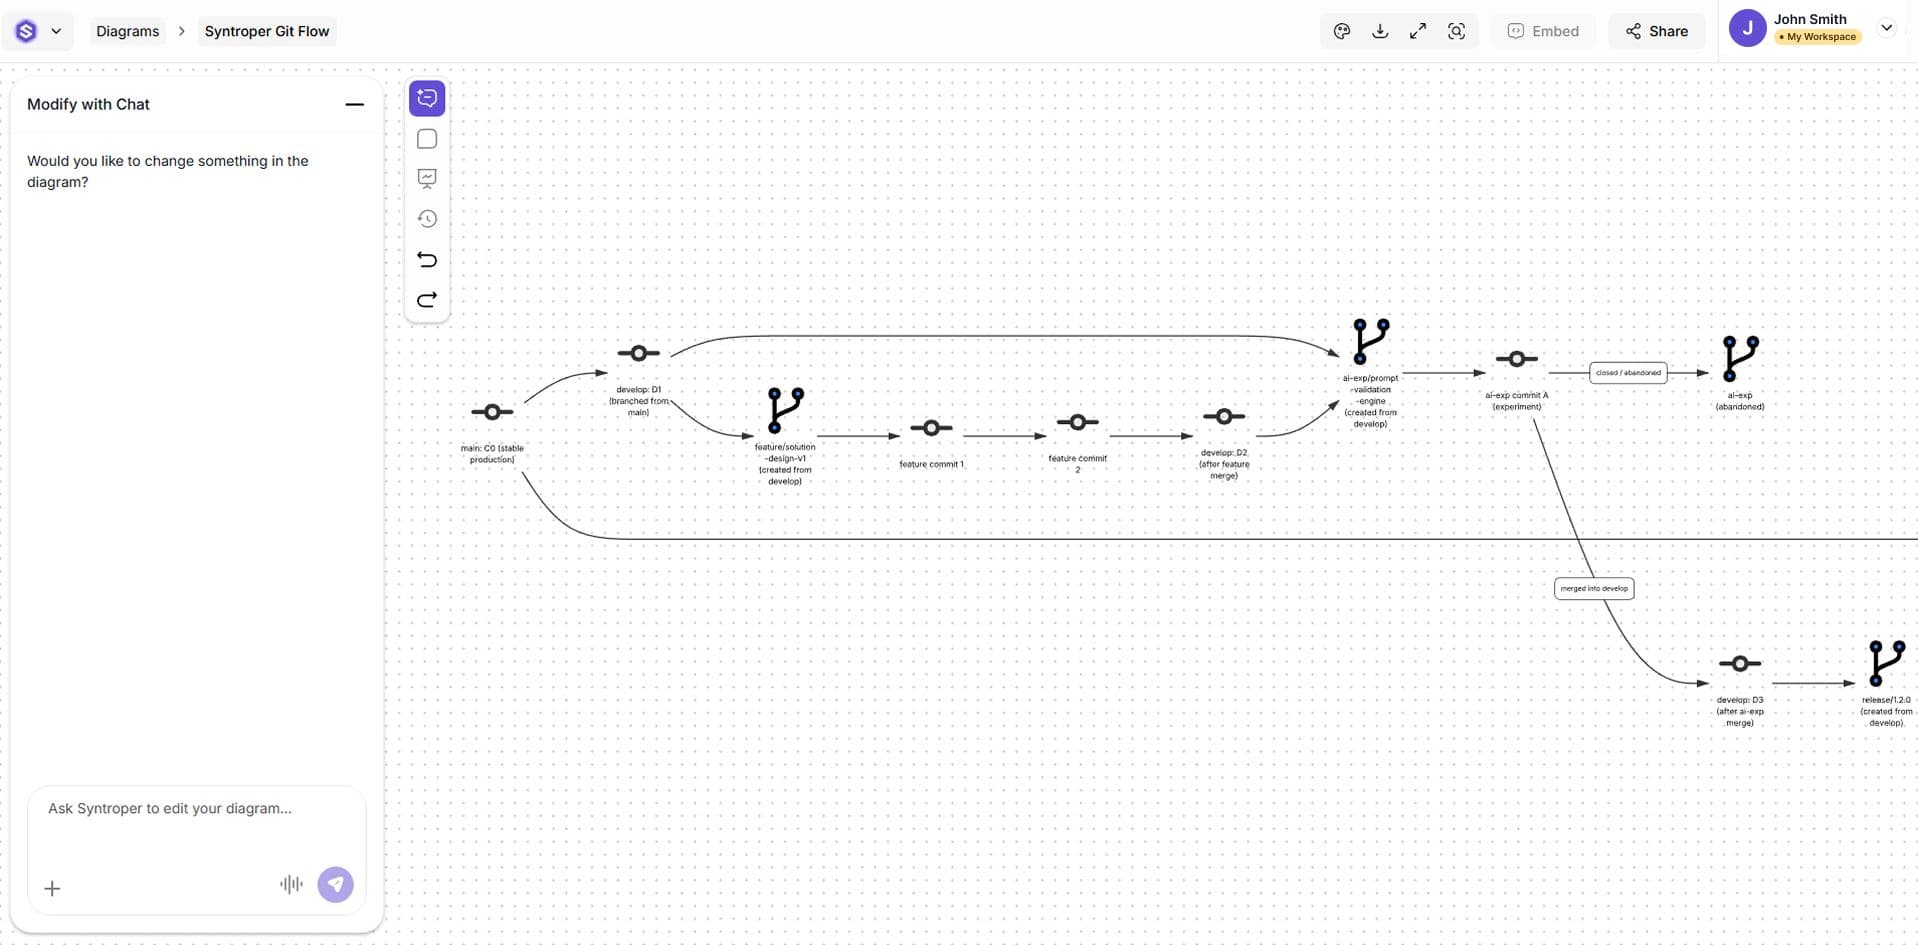
Git Graph diagrams provide a visual representation of repository history, showing branches, commits, merges, and release paths over time.
They are useful for understanding code evolution, collaboration patterns, and release workflows without diving into raw commit logs.
Typical usage:
- Track branch and merge history
- Visualize feature, release, and hotfix flows
- Review team collaboration timelines
- Audit repository changes over time
Last updated on February 16, 2026


